

By Nigel Crayton
Last year Moody’s stripped the District of its AAA rating. Apartment owners in DC have been living through their own version of that downgrade.
The hardest conversation I have had this year is with owners who bought or refinanced in the last cycle and are now hearing what their building is worth today. In some cases, District buildings have lost more than half their value since that last capital event.
Every building has its own story, but the pattern is consistent. Part of it is national: rates, inflation and operating costs. Part of it is specific to DC: collections, the courts, TOPA and policy risk. In my view the DC piece is the larger one, and it is also the piece the District can fix on its own.
This is not a doom and gloom piece. It is an honest look at how we got here, a road map for what the District needs to fix and why, and the case for why this reset is setting up one of the better entry points this market has seen in a long time.
How the same $10M building became a $5M building
The cleanest way to see what happened is through the formula many use to quickly price stabilized apartment buildings: value = net operating income ÷ cap rate. NOI is what the building collects after operating costs. The cap rate is the yield a buyer requires on the purchase price. When NOI falls and cap rates rise at the same time, value gets hit from both directions.
Below is one illustrative building, built from inputs we are seeing on DC rent controlled assets right now. It is not a claim that every building is down 50%. It shows how each pressure stacks on the last.
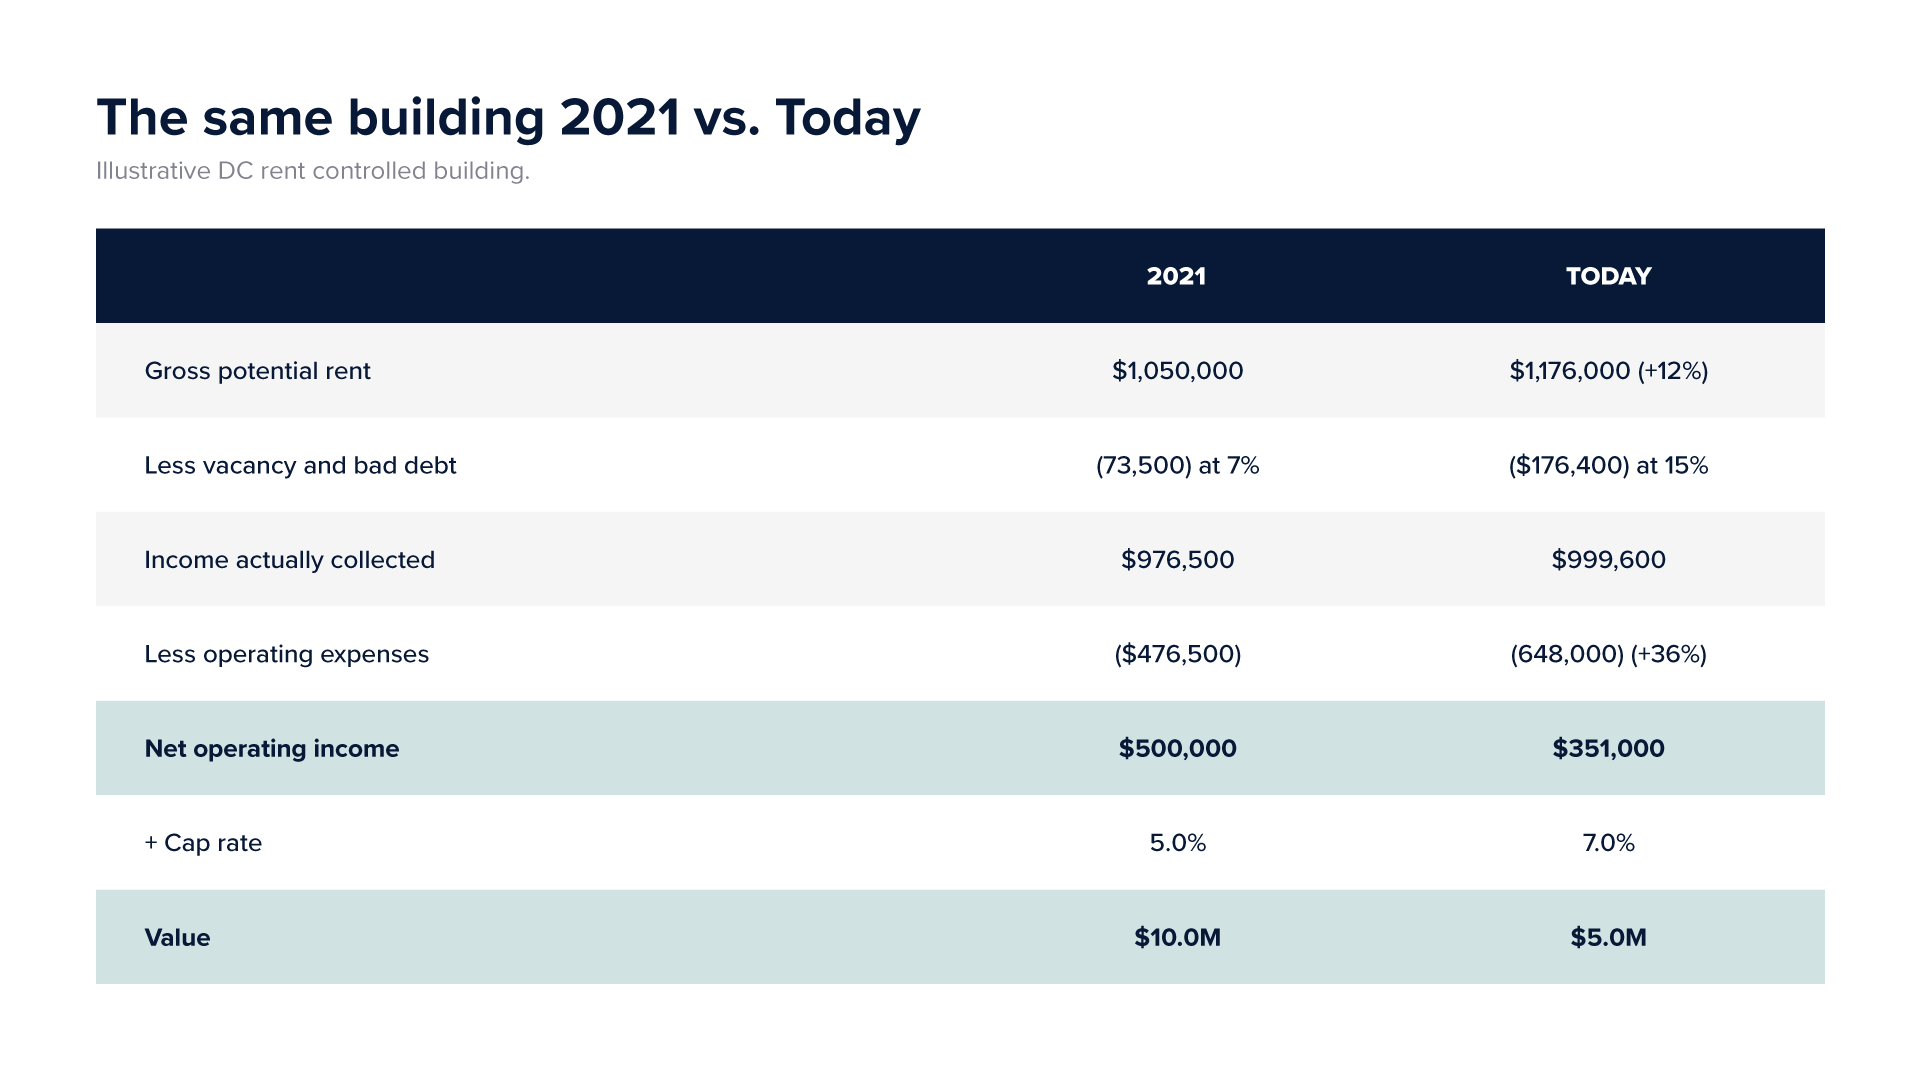
Collected income actually went up. Rent growth outran the collections problem on the top line. The damage is in what it now costs to run the building and what buyers now require to own it.
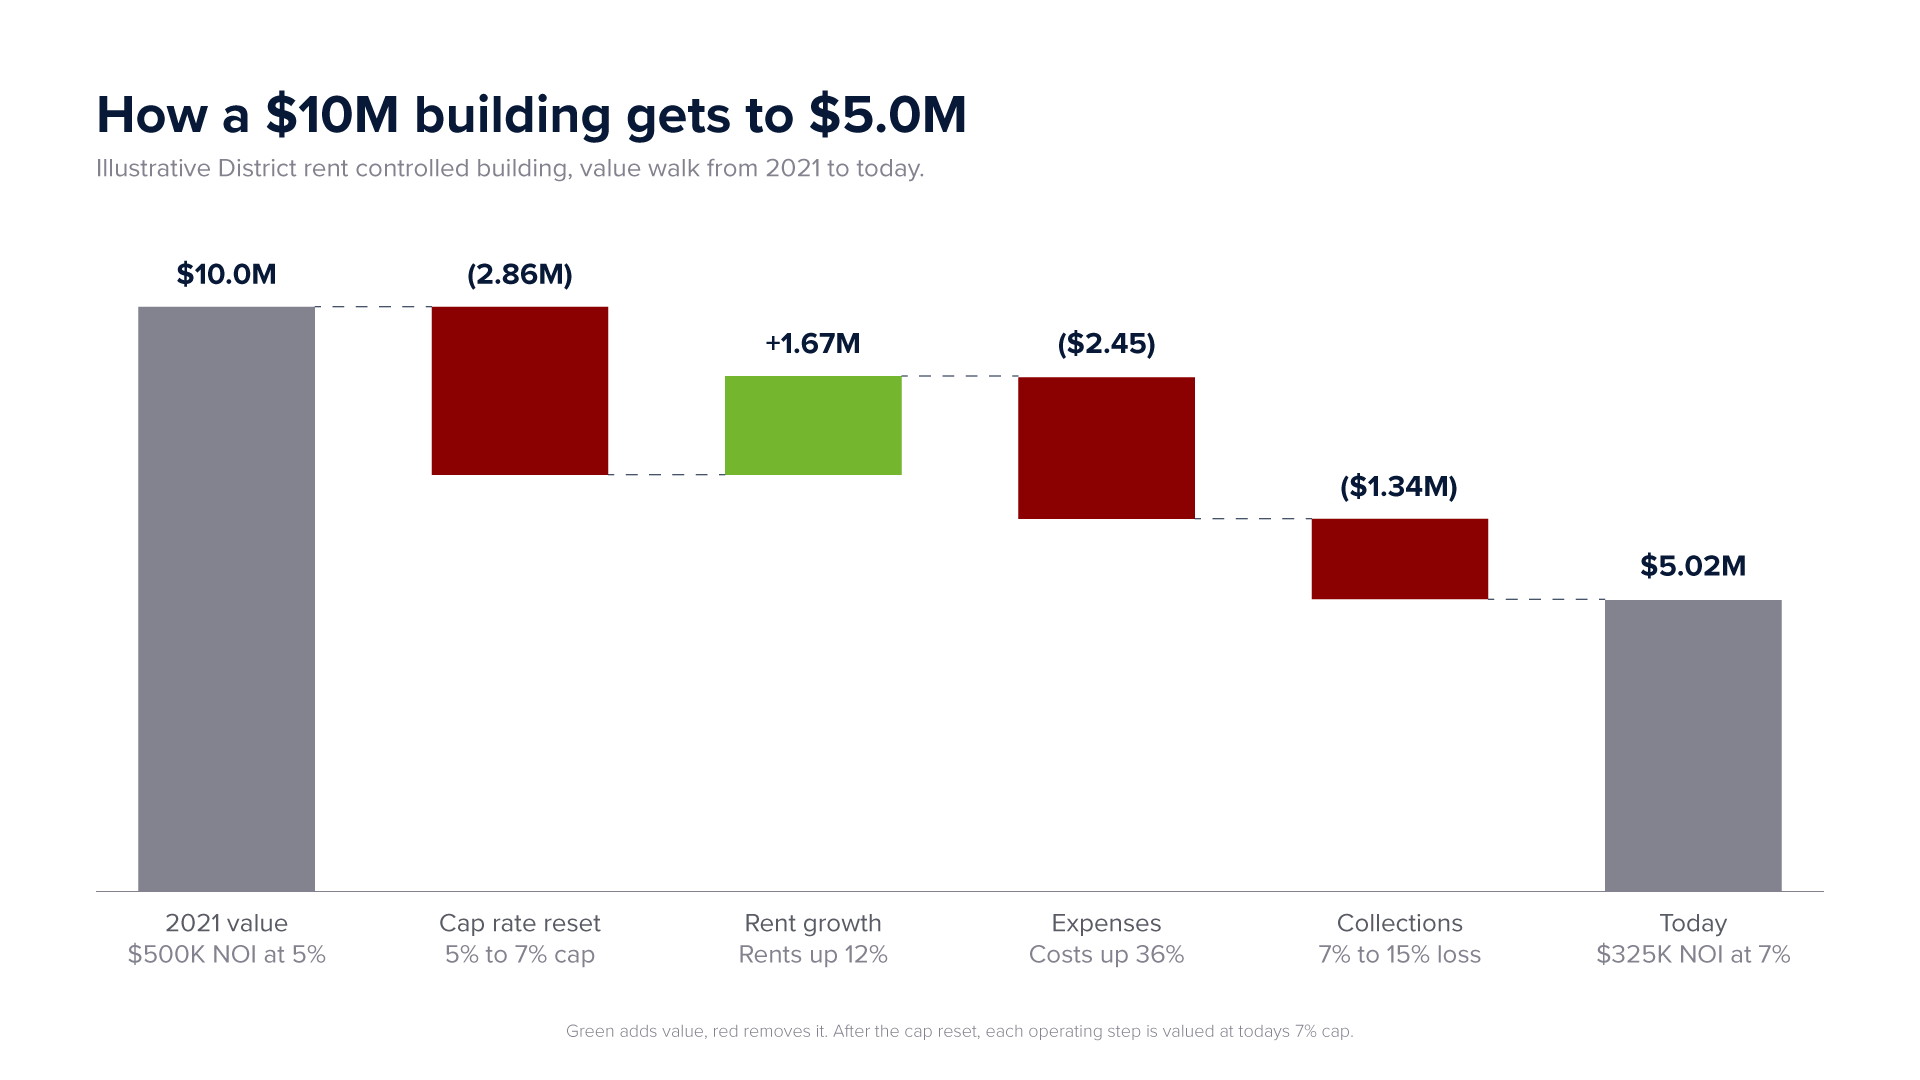
- Cap rate reset: ($2.86M). $500,000 ÷ 5% = $10.0M. The same $500,000 ÷ 7% = $7.14M. Nothing changed at the building. Only the price of capital changed.
- Rent growth: +$1.67M. Rents rose 12% over five years, about 2.3% a year, almost all of it from renewals under the rent control cap. Asking rents on new leases have been flat to down since 2024. That is $126,000 of additional rent, about $117,000 of it collected. $117,000 ÷ 7% = $1.67M.
- Expenses: ($2.45M). Insurance, payroll, utilities and taxes added $171,500 a year, a 36% increase. $171,500 ÷ 7% = $2.45M.
- Collections: ($1.34M). Going from 7% to 15% economic loss costs $94,080 of NOI a year. $94,080 ÷ 7% = $1.34M.
What a buyer is solving for
Whatever your return metric of choice is levered IRR, Cap rates, Unlevered IRR, Yield on Cost, Cash on Cash, etc. they do not move on their own. They are anchored to some version of the Treasury, the market’s benchmark for a risk-free return, and so is the debt that finances almost every acquisition.
Debt. Lenders price commercial mortgages as a spread over Treasuries. Today that spread is roughly 150 basis points, so with the 10 year at 5.1%, a loan prices around 6.6%. In 2021 the Treasury sat near 1.5%, spreads ran closer to 175 basis points, and the same building borrowed at about 3.25%. When the Treasury moves, every loan quote moves with it, and loan proceeds move with them.
Equity. A buyer prices the building the same way the bank prices the loan: Treasury plus a spread for the risk. The spread is where the asset, the submarket and, in DC, the regulatory environment get priced in.
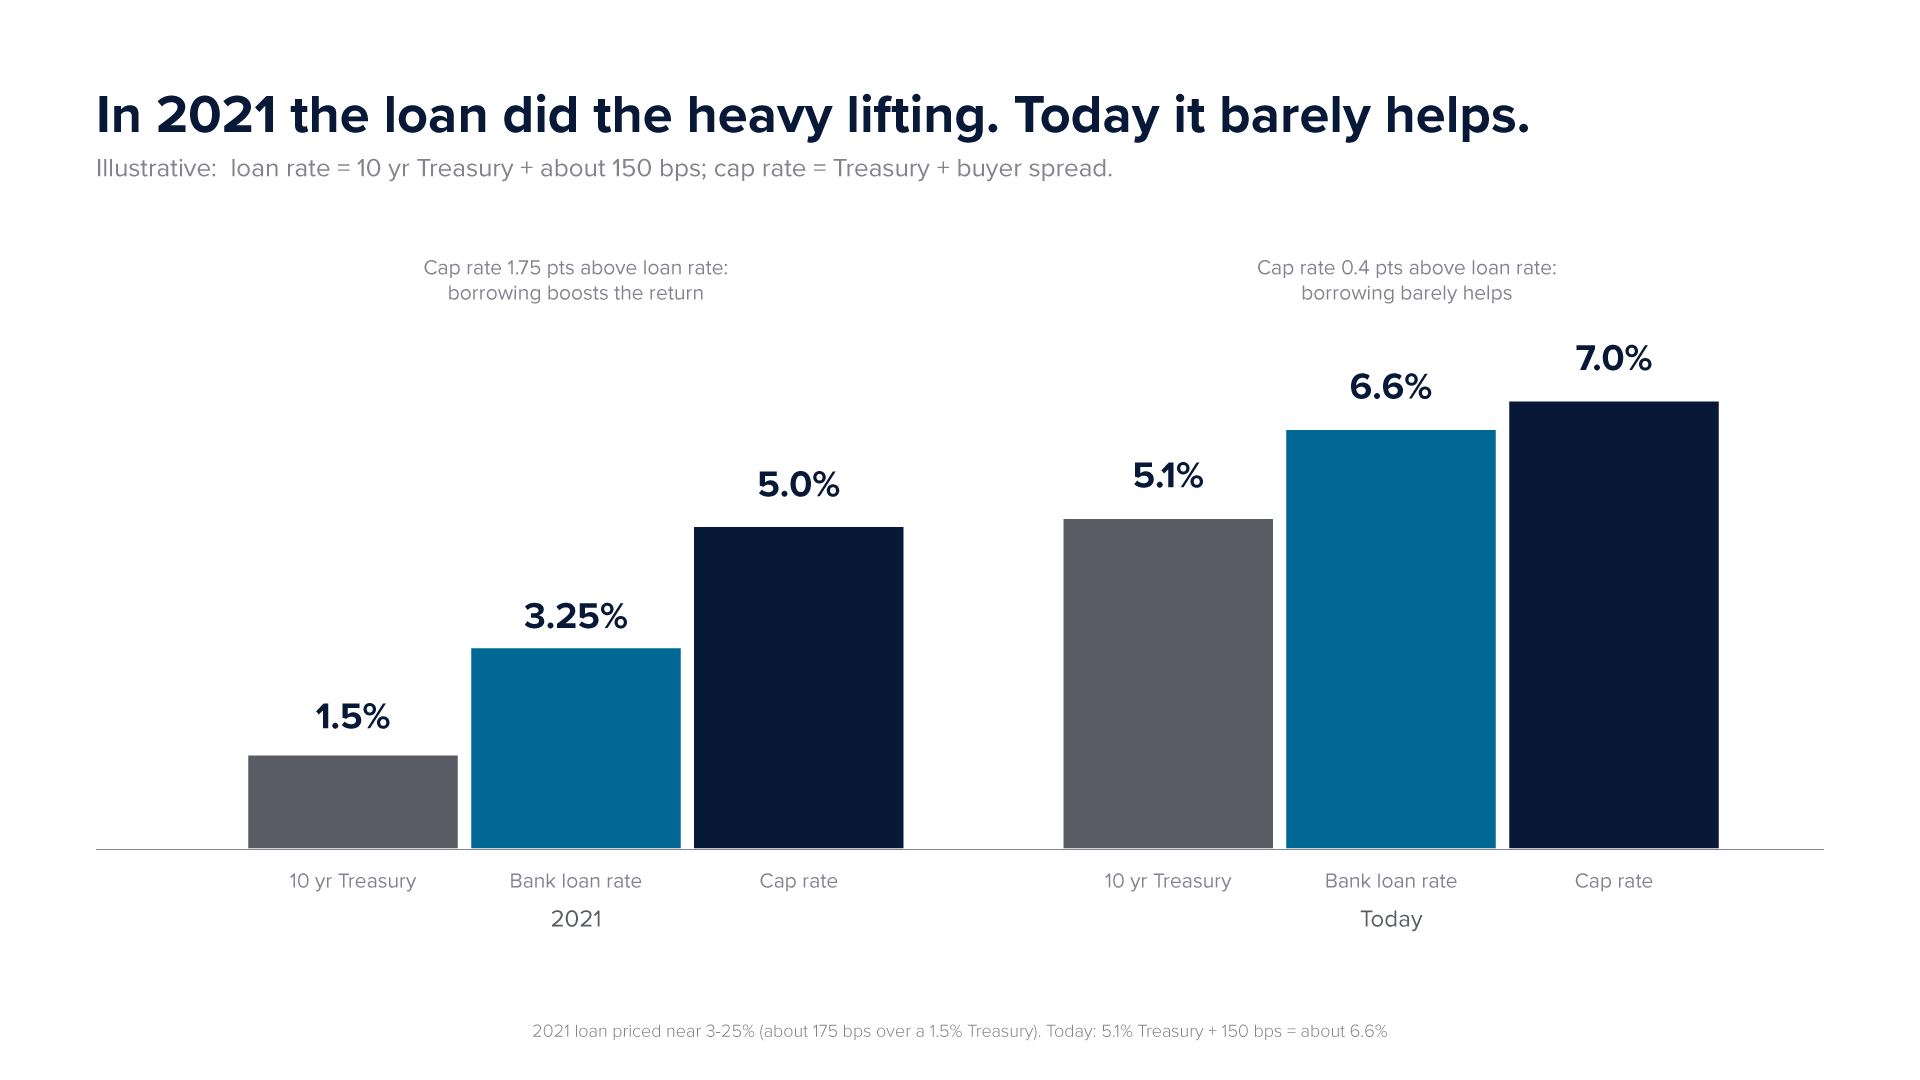
In 2021 the building yielded 5% against a 3.25% loan. Every borrowed dollar earned 1.75 points more than it cost, and that positive leverage did a lot of the work behind last cycle’s pricing. Today the building yields about 7% against a 6.6% loan. Leverage barely helps, so the return has to come from the building itself.
Here is how the buyer’s required spread translates into cap rate and value, holding the Treasury at 5.1% and the bank spread at 1.5 points:
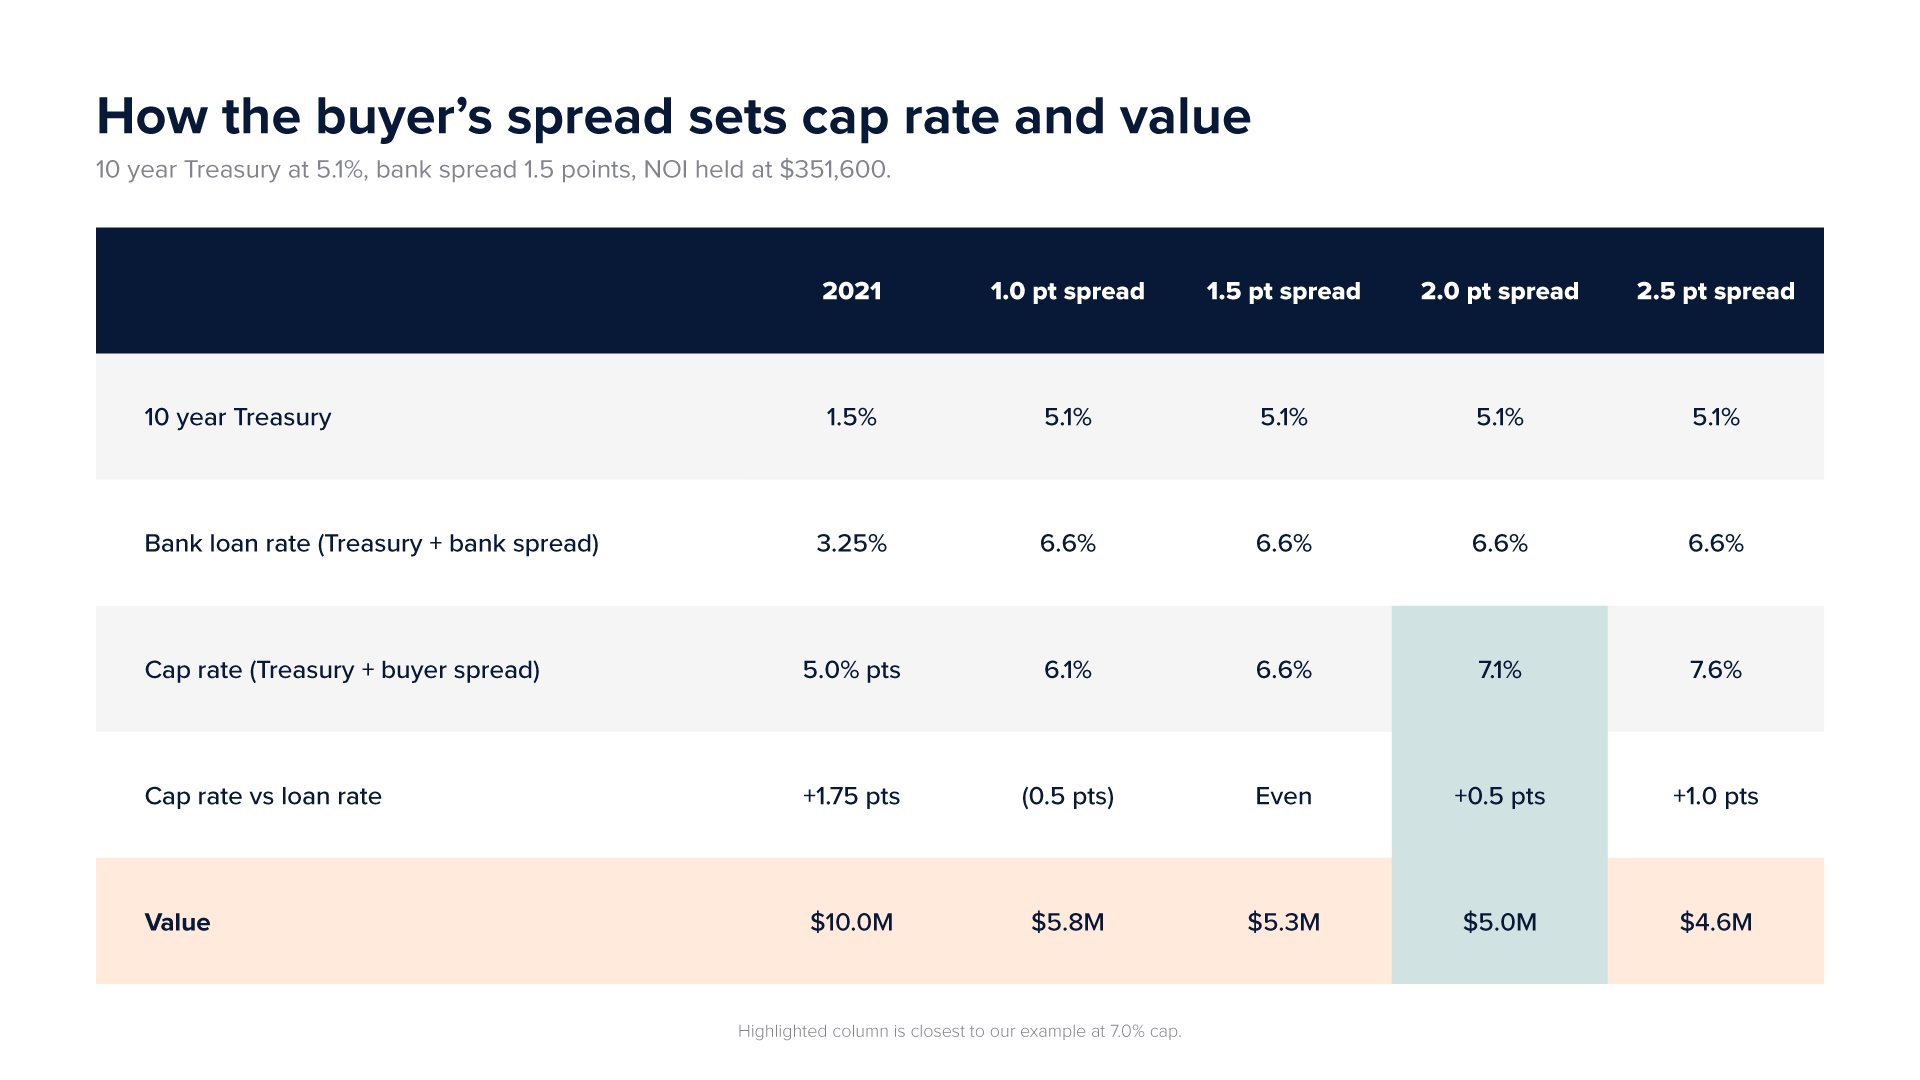
When the buyer’s spread matches the bank’s, the cap rate equals the loan rate and leverage is neutral: 6.6%, or about $5.3M. When the buyer requires about 2.0 points, the cap rate moves to roughly 7%, where our example sits, and value drops to about $5.0M. That half point of spread is worth about $375,000 on this building. A buyer will only go below the loan rate, the 1.0 point column, if they have conviction that rents will grow into the price.
That is the key to understanding DC pricing. In markets with a credible growth story, buyers will accept a thinner spread than the bank and let rising rents close the gap. In DC, most will not, and the reasons are local.
The range, not the point
No two buildings land in the same place. Where one falls depends mostly on two things: how much of its rent it actually collects, and how much risk a buyer sees in it. Here is the same building, same rent roll and expenses, across both. Rows are economic loss, columns are cap rate, and our example is in bold.

- Even the best case is down. A building collecting at historical norms and priced at a 6% cap is worth about $7.4M, still 26% below 2021. That is the expense and rate story, and owners everywhere are feeling it.
- Collections carry more weight than the cap rate. Moving from 15% loss to 10% at a 7% cap adds about $840,000. Moving the cap from 7% to 6.5% at the same collections adds about $390,000. Fixing the rent roll beats waiting on the market.
- The dispersion is wide. A well-run building losing 10% in a submarket that trades at 6.5% is worth about $6.3M, down 37%. A building losing 20% at a 7.5% cap is worth about $3.9M, down 61%. Most of my conversations this year fall somewhere inside this grid.
One caveat. The grid holds NOI flat, and buyers rarely price a building on in place income alone. The ones paying above this grid are underwriting a specific path to higher NOI: below market rents that reset on turnover, units that can be renovated, , expenses a better operator can cut, a tax assessment that can be appealed, excess density, etc.. Those levers are real, and that is why two buildings with the same rent roll can trade at two very different prices. The grid is the floor that conversation starts from.
How debt pushes value down
Most buyers back into price from the loan they can get, and lenders size to debt service coverage, typically 1.25 times NOI over the annual mortgage payment. Run our building through that standard on 30 year amortization and the debt tells the same story.
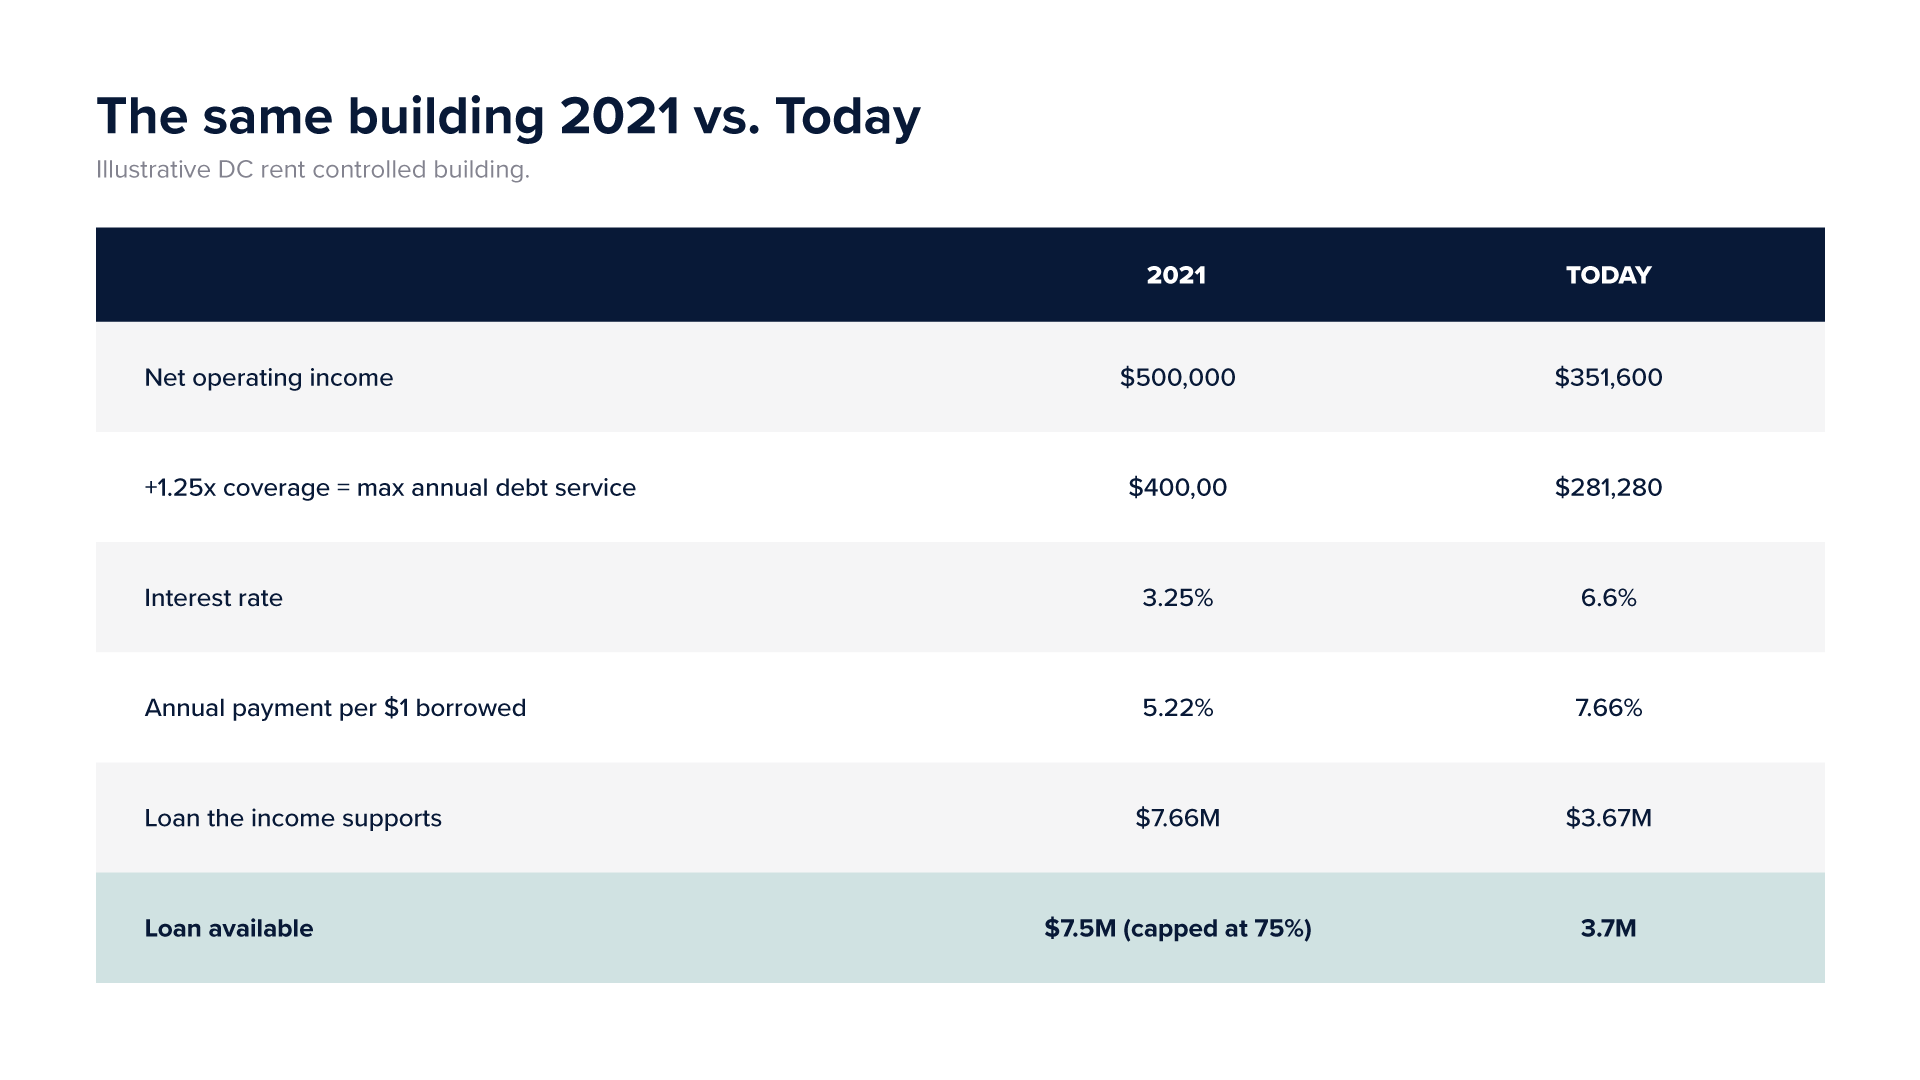
In 2021 the loan was constrained by leverage. Today it is constrained by coverage, and proceeds are cut by more than half. A $3.7M loan against a $5.0M purchase is about 73% leverage. The debt math and the cap rate land in the same place.
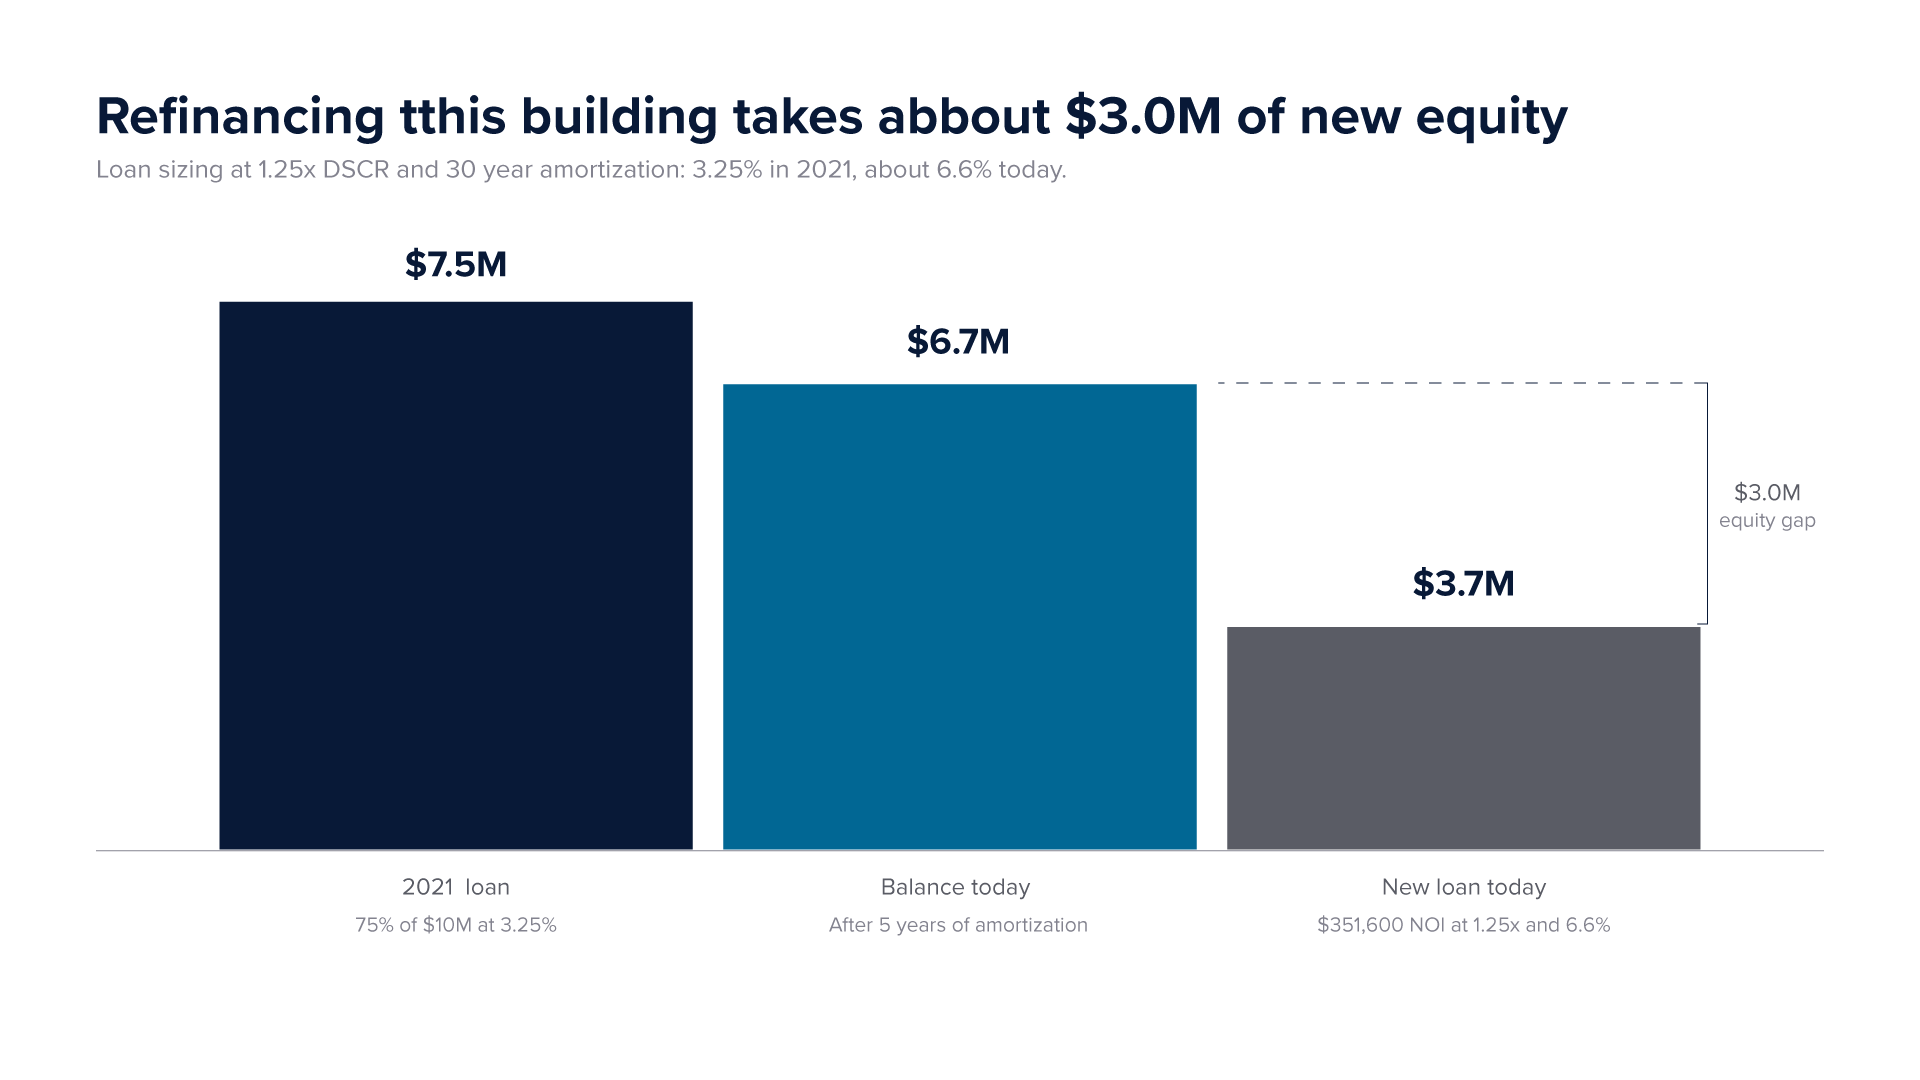
For the existing owner, the pressure shows up at maturity. After five years of amortization the $7.5M loan is down to about $6.7M. A new lender sizes to about $3.7M, so keeping the building takes roughly $3.0M of new equity. That gap is the conversation happening in a lot of conference rooms right now. The building is still a good building. The capital stack just no longer fits it.
Why it happened: the national story
The national story is the one owners are living in every market: costs went up, rents did not keep pace, and capital got more expensive.
Inflation. Something that cost $100 in September 2021 costs about $123 today, and inflation reaccelerated to 3.7% year over year in the latest print. In DC terms: a District unit that rented for $2,110 in 2019 was asking $2,436 by March 2026. Nominally that is an increase. After inflation it is a 14.7% cut in what the owner can actually do with the rent.
Interest rates. The 10-year Treasury averaged roughly 1.5% when most of the last cycle traded. It topped 5.35% on October 7, its highest level since 2002, and is at 5.14% as I write this. Because lenders price off the Treasury, debt that cost about 3.25% in 2021 now prices around 6.6%, and that higher base rate flows directly into the return buyers require on their equity.
Operating costs. Trepp’s national data shows multifamily operating expenses grew more than 30% from 2021 to 2025, outpacing both revenue and NOI. Insurance drove much of it: the Minneapolis Fed found premiums in 2024 were double 2021 levels. Utilities add another layer, and the D.C. Policy Center found they consume more than half the operating budget at some affordable properties.
In our example, expenses up 36% against rents up 12% takes roughly $780,000 of value off the table on its own. Every market felt some version of that. DC felt something more.
Why DC fell further: the DC discount
National forces explain why values fell everywhere. They do not explain why DC fell further than Arlington, Alexandria or Montgomery County. I sell buildings on both sides of the District line, and the difference shows up in every deal: fewer bidders, wider pricing, longer closings and more retrades. That is the DC discount. It has five parts. One is market driven and already correcting. The other four are policy outcomes, which means the District has the power to change them.
- Supply arrived just as demand left
From 2020 to 2022, with rates near zero, the District permitted nearly 20,000 units, and the region has spent the last two years absorbing its heaviest wave of deliveries in decades. Then demand fell off. The District recorded 30,813 federal separations in 2025, and by November total District jobs were 29,500 below January levels. The D.C. Policy Center found the city had no net migration gain at all in 2025.
District asking rents fell 10.7% from 2019 to 2025, the steepest drop in the region, and closed 2025 down 3.7% year over year. When new deliveries are leasing with concessions, every older building competing for the same renter feels it. This is the one piece that will correct on its own. The pipeline is emptying fast.
- Collections and the courts
Historically we underwrote 5% to 7% economic loss. On many District assets the honest number today is 15% to 25%. Owners have lost well over $1 billion in rent since the pandemic, roughly a third report tenants who have not paid in more than two years, and DC rent arrears per unit are the highest in the nation by a wide margin.
The clearest proof is in the city’s subsidized housing: buildings with tax credits, public financing and mission driven owners behind them.
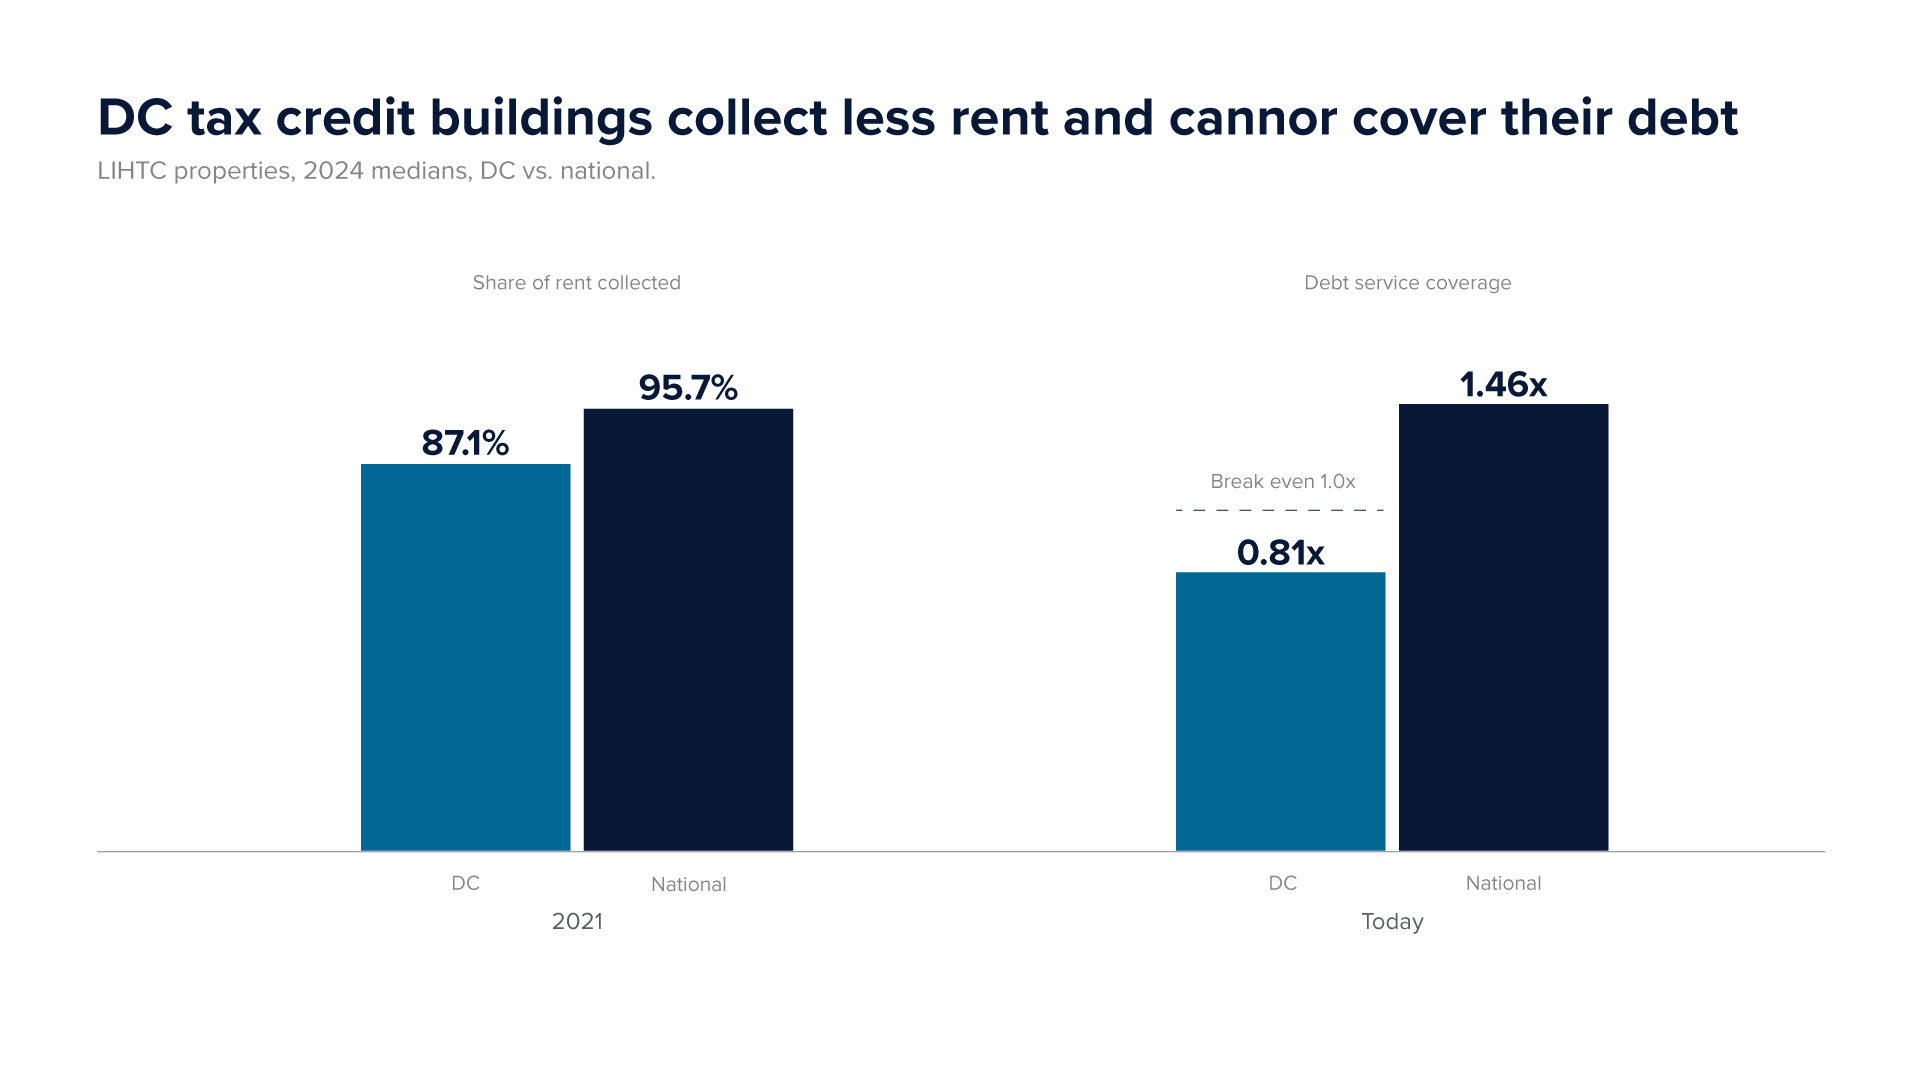
Nationally, tax credit properties collected nearly 96% of scheduled rent in 2024. In DC it was 87%, the worst in the country, and two thirds of DC properties collected less than 90%. The median DC property cannot cover its mortgage, and DC is the only jurisdiction where these buildings run negative cash flow on average. Privately owned rent-controlled buildings in the same neighborhoods face the same collections problem without any of that support.
Collections are the symptom. The cause is that an owner in DC has no reliable, timely way to enforce a lease. A nonpayment case now takes three to five months to reach a first hearing and 13 to 15 months to reach trial. In most jurisdictions, two months of missed rent leads to action. In DC it can take more than a year, and every month of delay is rent that is unlikely to ever be recovered.
A large part of the slowdown is a pandemic holdover. DC is the only jurisdiction in the region still holding initial landlord tenant hearings virtually. Before the pandemic, about half of cases settled, usually on the day of the in person hearing, when both sides were in the same room with a deadline in front of them. In 2025 it was 4%.
For a buyer, this is the hardest risk to underwrite. You are not just pricing today’s bad debt. You are pricing the absence of a timely remedy if it gets worse.
- TOPA: the execution risk
The Tenant Opportunity to Purchase Act is unique to DC. When an owner sells, tenants hold the first right to buy the building and can assign that right to a third party, usually a developer or nonprofit partner. The intent is sound: give tenants a seat at the table when their building changes hands. In practice, TOPA has become the single largest source of execution risk on a DC sale.
Start with the clock. On a building with five or more units, tenants have up to 45 days after the offer of sale to organize and register interest. That opens a negotiation period of at least 120 days, a 15 day window to match a third party contract, and at least 120 more days to arrange financing, extended if a lender says it needs up to 240. If tenants organize, a sale can sit for 420 days. A comparable sale across the river in Virginia closes in a fraction of that time.
That time turns into price:
- Rate risk. A buyer agrees to a price today and may not close for a year. If the Treasury moves 50 basis points in that window, the loan on our building shrinks by about $180,000. Buyers price that in on day one.
- Capital at risk. Deposits, legal, lender costs and third party reports sit out for most of a year with no certainty of closing.
- Payments to tenants. Many deals involve negotiated payments to tenant associations to assign or waive their rights. That cost does not exist in Maryland or Virginia, and it comes out of the price.
- A thinner bid. A meaningful share of national capital simply screens out DC. Fewer bidders means less competition and wider cap rates for every seller.
TOPA also reaches beyond sales. Until the RENTAL Act, certain changes in ownership interest could trigger the process, which complicated exactly the recapitalizations troubled buildings need right now. That fix helped. The timeline and cost uncertainty remain.
- Rent control: capped upside, uncapped costs
Most of DC’s older apartment stock (built before 1975) is rent controlled. Annual increases are capped at inflation plus 2%, which works out to 4.1% for the current rent control year and 2.1% for elderly and disabled tenants. There is no cap on insurance, payroll, utilities or taxes. A buyer is looking at income that can only grow so fast, expenses that grow as fast as the market pushes them, and collections that depend on a court system that takes a year to act. That asymmetry gets priced.
So does the threat of more. Initiative 88 would freeze all private rents, including new construction, for two years, trigger a new 12 month freeze in any year inflation tops 5%, and cut the rent control ceiling from 10% to 6%. Inflation is at 3.7% today. A court challenge was dismissed as untimely in September and is on appeal. A buyer cannot underwrite rent growth with a freeze on the table, and without rent growth there is no case for accepting a spread thinner than the bank’s.
- Policy and narrative risk
Capital prices uncertainty, and the District is giving it a lot to price. DC will have a new mayor in January for the first time since 2015. Councilmember Janeese Lewis George won the Democratic primary in June and heads into the November 3 general election as the clear favorite, alongside several new Councilmembers. Her platform calls for 72,000 new homes over five years through zoning changes and faster permitting, which the industry broadly supports. It also calls for updating rent stabilization without saying how. She voted against the RENTAL Act and has not said publicly where she stands on Initiative 88. Until investors see how a new administration handles rent control, TOPA and the courts, they will underwrite the full range of outcomes, not the midpoint.
Taxes are now part of that range. The D.C. Policy Center puts the District’s fiscal 2028 gap at roughly $680 million, even after $539 million in cuts, and on October 16 the Council held a hearing on ways to close it: a 3% tax on investment income for high earners, higher property taxes on luxury second homes, a business activity tax the CFO is now studying, and a bill to assess land separately from buildings, the groundwork for a land value tax. None of it is law, and none of it targets apartment buildings directly. But the investment income tax is modeled on the federal version, which reaches rental income and sale gains for passive investors, and a buyer looking at a budget hole that size has to underwrite the chance that some of it gets closed on property owners.
The legislative calendar adds to it. The Council and the Mayor have advanced the RENTAL Act and now the Housing Investment Protection Act, both reshaping TOPA and eviction rules, and proposals to expand the District’s own purchase rights under DOPA keep resurfacing. Some of that reform is constructive. But each new proposal, and each round of rhetoric about owners, adds basis points to the risk premium. The capital response is already in the data: the District is on pace to permit about 436 units in 2026, the fewest since 1998, and a single multifamily building pulled a permit in January.
The DC discount in dollars
The DC premium is not a line item added on top of the cap rate. It is the compression DC is not getting. Strip out the local risk and a DC building should collect like it did before the pandemic and trade at least at the bank’s spread. Here is what that gap is worth on our building.
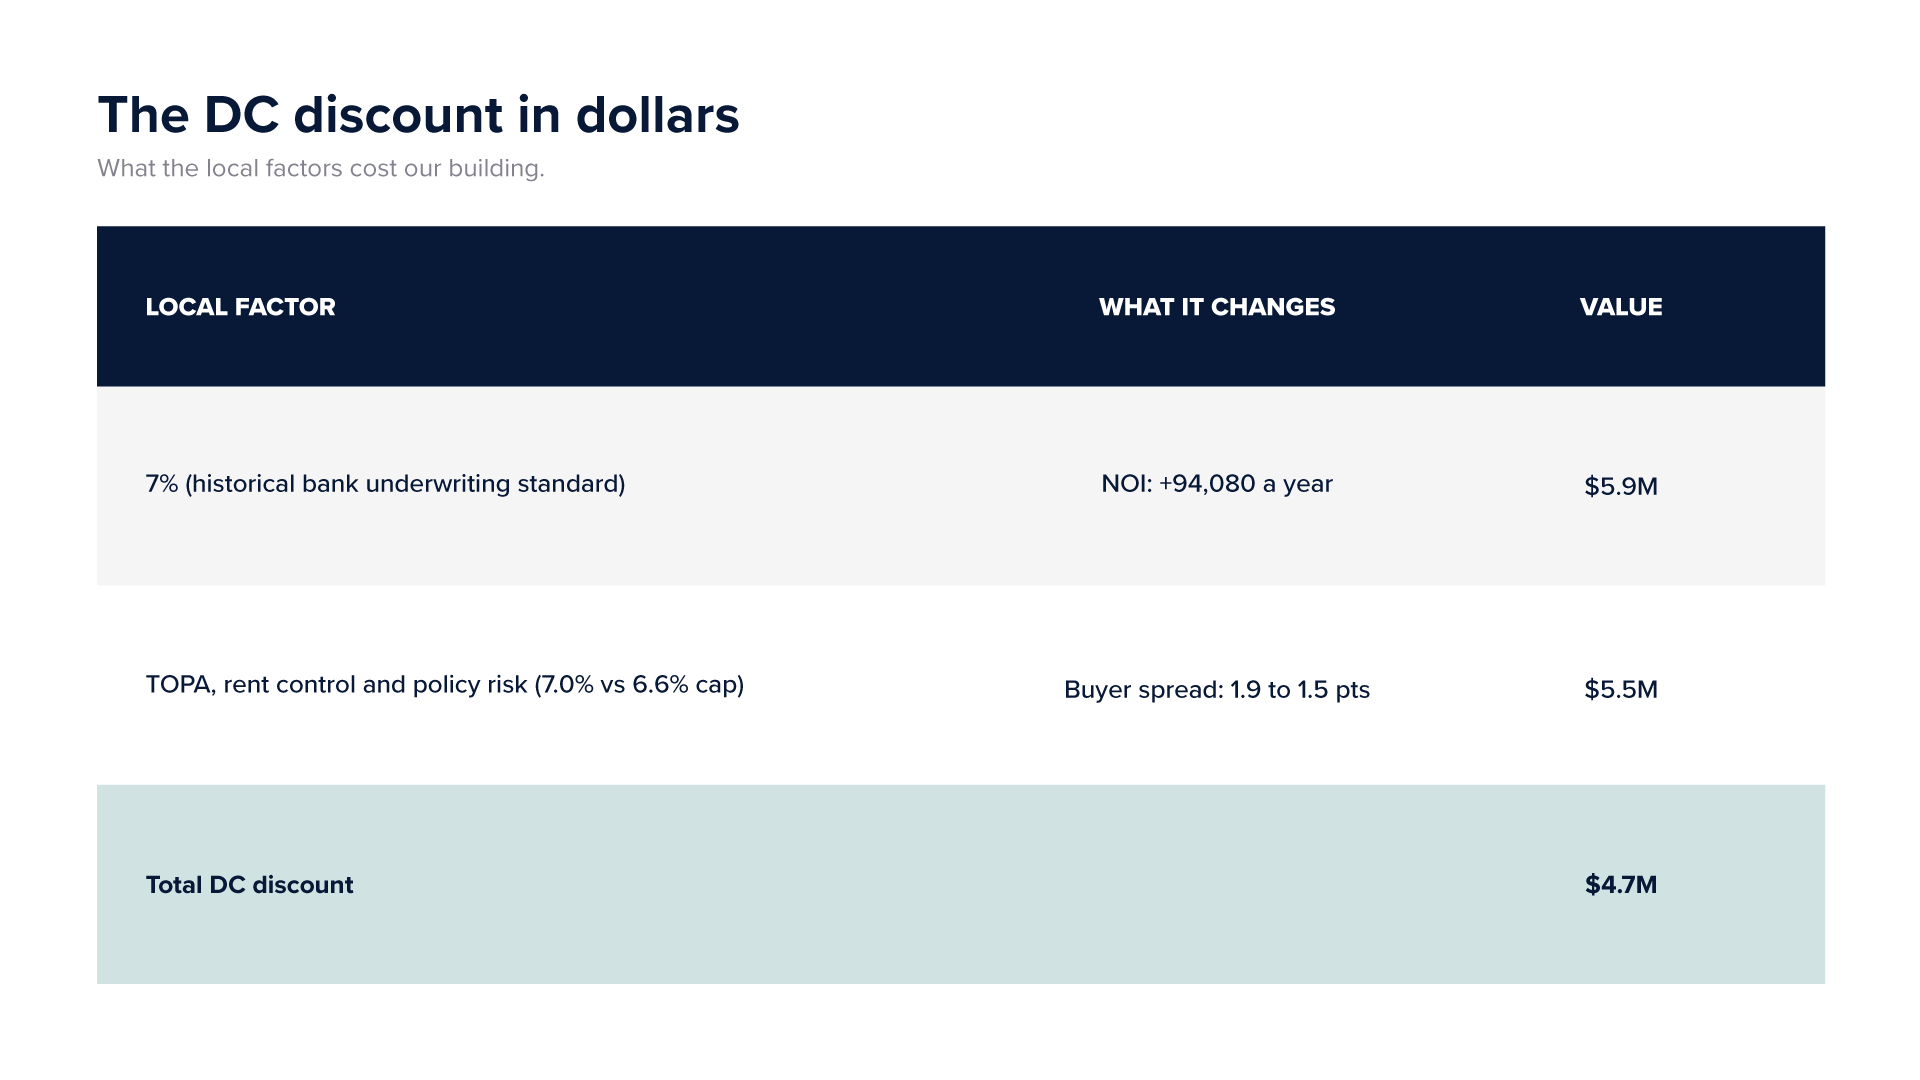
That is roughly a third of today’s value, and none of it depends on the Federal Reserve. It is also conservative: it assumes no rent growth and stops at the bank’s spread rather than the thinner spreads growth markets command.
A road map for the District
This is not just an owner problem. Lower values mean lower assessments and less property tax revenue for a city that has already lost its AAA rating. Owners who cannot refinance cannot fund capital improvements, so tenants live with the deferred maintenance. And capital that will not build today means fewer homes and higher rents later. Four of the five drivers of the DC discount are policy outcomes, which means they can be fixed locally. Here is where I would start and, where the math is direct, what each fix is worth.
- Restore a working court process. This is the single biggest lever, and the backlog is not a judge shortage. The court has more magistrate judges today than in 2019 and fewer than half the filings. What changed is that virtual hearings removed the courthouse deadline that used to drive settlements. Return to in person initial hearings, keep a virtual option for tenants who need it, set a hearing within 60 days of a nonpayment complaint, and have rent paid into a court registry while a case is pending. This is not about evicting more families. Delay has done that: by the time a case reaches trial the average tenant owes over $7,000, too much to catch up on, and the share of filings ending in eviction has roughly tripled since 2019. Faster resolution means more settlements and more families staying housed. Worth: about $1.34M on our building.
- Make TOPA predictable. Keep the tenant right to purchase. Fix the parts that add risk without helping tenants buy: hard deadlines with limited extensions, a public filing system at DHCD that shows where every TOPA process stands, clear rules on what counts as a sale building on the RENTAL Act, and transparency around payments to assign or waive rights. A buyer who knows when a deal will close and what it will cost does not need to charge a premium for the unknown. Worth: about $190,000 for every 25 basis points of premium removed.
- Clear, stable policy. Apartment investments are 7-to-10-year commitments at a minimum. When a rent freeze, an expanded DOPA or a new TOPA wrinkle surfaces every few months, no one can forecast the hold, so capital either prices the uncertainty or stays away. Settle the rent control framework and hold it. Worth: together with TOPA reform, about 40 basis points of cap rate, or roughly $390,000 on our building in the reverse walk below.
- Fix the rental assistance pipeline. Voucher holders are some of the most reliable rent in the city once payments flow. Today owners wait 60 to 75 days for lease approvals and six or seven months for a first payment, and only about 71% of the District’s voucher allocation is actually leased while 17,000 households sit on the waitlist. Faster inspections and payments fill vacant units and cut bad debt at the same time.
- Tax assessments that match real income. Rent controlled and income restricted buildings are often assessed as if they were market rate. Aligning assessments with actual regulated income, as the D.C. Policy Center recommends, puts money straight back into NOI and into the buildings.
- Make it easier to build and reinvest. Faster, predictable permitting and by right approvals lower the cost of renovating existing stock and bring new capital into neighborhoods that need it.
Several tailwinds are already in motion:
- Supply is drying up. The District is on pace for its fewest permitted units since 1998, and the pipeline behind today’s deliveries is the thinnest in decades. Less new product means older buildings stop competing against concessions, and that is how rent growth comes back.
- The rules are already improving. The RENTAL Act exempts buildings under 15 years old from the TOPA offer of sale and stops internal ownership changes from triggering TOPA when control stays the same. Emergency rental assistance reform ended the indefinite case stays tied to pending applications. Both shorten timelines and reduce friction on recapitalizations.
- Rates have come off the highs. The 10 year pulled back from above 5.35% on October 7 to about 5.1% this week. Every move lower brings loan rates down with it and narrows the gap between what sellers need and what buyers can pay.
Running the numbers in reverse
We cannot control the Fed, geopolitics or the cost of debt. What the District can control runs on the same math that took value out, and it puts value back. Start with our building at $5.0M and change only the two things DC can fix on its own.
- Courts and collections: +$1.34M. Economic loss from 15% back to the 7% norm adds $94,080 of NOI. $94,080 ÷ 7% = $1.34M.
- TOPA and policy clarity: +$0.39M. NOI is now $445,680. If buyers price DC at the bank’s spread, a 6.6% cap instead of 7%, it is worth $6.75M instead of $6.37M.
That is a 34% gain from today’s value with no rent growth and expenses held flat. Lower rates, a return of rent growth, a rebound in District employment, or buyers once again pricing DC like a growth market would all be upside on top of this.
The upside
The District still has what most cities would trade for: a deep renter base, one of the most educated workforces in the country, a walkable core, world class transit, the federal government as an anchor employer, and the nation’s capital. None of that went away.
The region is also building its next chapter around DC, not away from it.
- The District released its master plan for the 190 acre RFK campus in June: a 65,000 seat Commanders stadium opening by fall 2030, 5,000 to 6,500 homes with 30% set aside as affordable, and an expanded Stadium Armory Metro station. That is an entirely new neighborhood on the east side of the city.
- AI and tech. Northern Virginia is the largest data center market in the world, and AI related investment has become one of the main forces holding up the regional economy. Virginia Tech’s $1B Innovation Campus opened in Alexandria in 2025, and Amazon’s HQ2 at National Landing has 8,500 employees in the office five days a week. That is a high wage employment base growing next door, and those workers need places to live.
- Monumental’s roughly $800M renovation of Capital One Arena keeps the Wizards and Capitals downtown for decades and anchors the Gallery Place corridor.
None of these fix collections, TOPA or court timelines on their own. They are the reason the demand will be there once the local fixes are in place.
The reset is the opportunity
The reset is painful for anyone who bought or borrowed last cycle. It is also what creates the next.
At the $5.0M example, the building is priced for today’s problems: 15% economic loss, a 7% cap, 6.6% debt and the full DC discount. A buyer at that basis is not paying for a recovery. The recovery is upside. If collections return to the 7% norm, the same building produces $445,680 of NOI, an 8.9% yield on the purchase price before any rent growth. Against a 6.6% loan, that is more than two points of positive leverage, a wider margin than the building had in 2021. Add TOPA and policy clarity and it is worth about $6.75M. Add modest rent growth as supply dries up, and it goes further. All of that is before debt gets any cheaper.
The same holds for owners who recapitalize. A capital stack rebuilt at today’s basis fits the building again, and the owner who brings in new equity now participates in the recovery instead of fighting the old loan.
For the District, the message is simple. About 20% of this building’s lost value is local, and it sits on a short list: courts, TOPA, rent control certainty and the voucher pipeline. Multiply that across every rent controlled building in the city and the stakes are the tax base, the housing stock and the next decade of investment.
I am genuinely optimistic about where DC goes over the next three to five years. Values have already absorbed the hard part. What is left is fixable, and the work on several pieces has already started.
Contact

Nigel Crayton
Senior Director | Investment Sales
ncrayton@greysteel.com
202.919.9400
Greysteel Advisory Expertise
Greysteel is a commercial real estate advisory firm specializing in investment sales and debt and structured finance, serving institutional clients, private investors, and middle-market operators nationwide.
The firm provides sector-focused advisory across all asset classes, delivering market intelligence, capital markets expertise, and disciplined execution.